Case study — Sustainable adoption in climate-tech
TL;DR
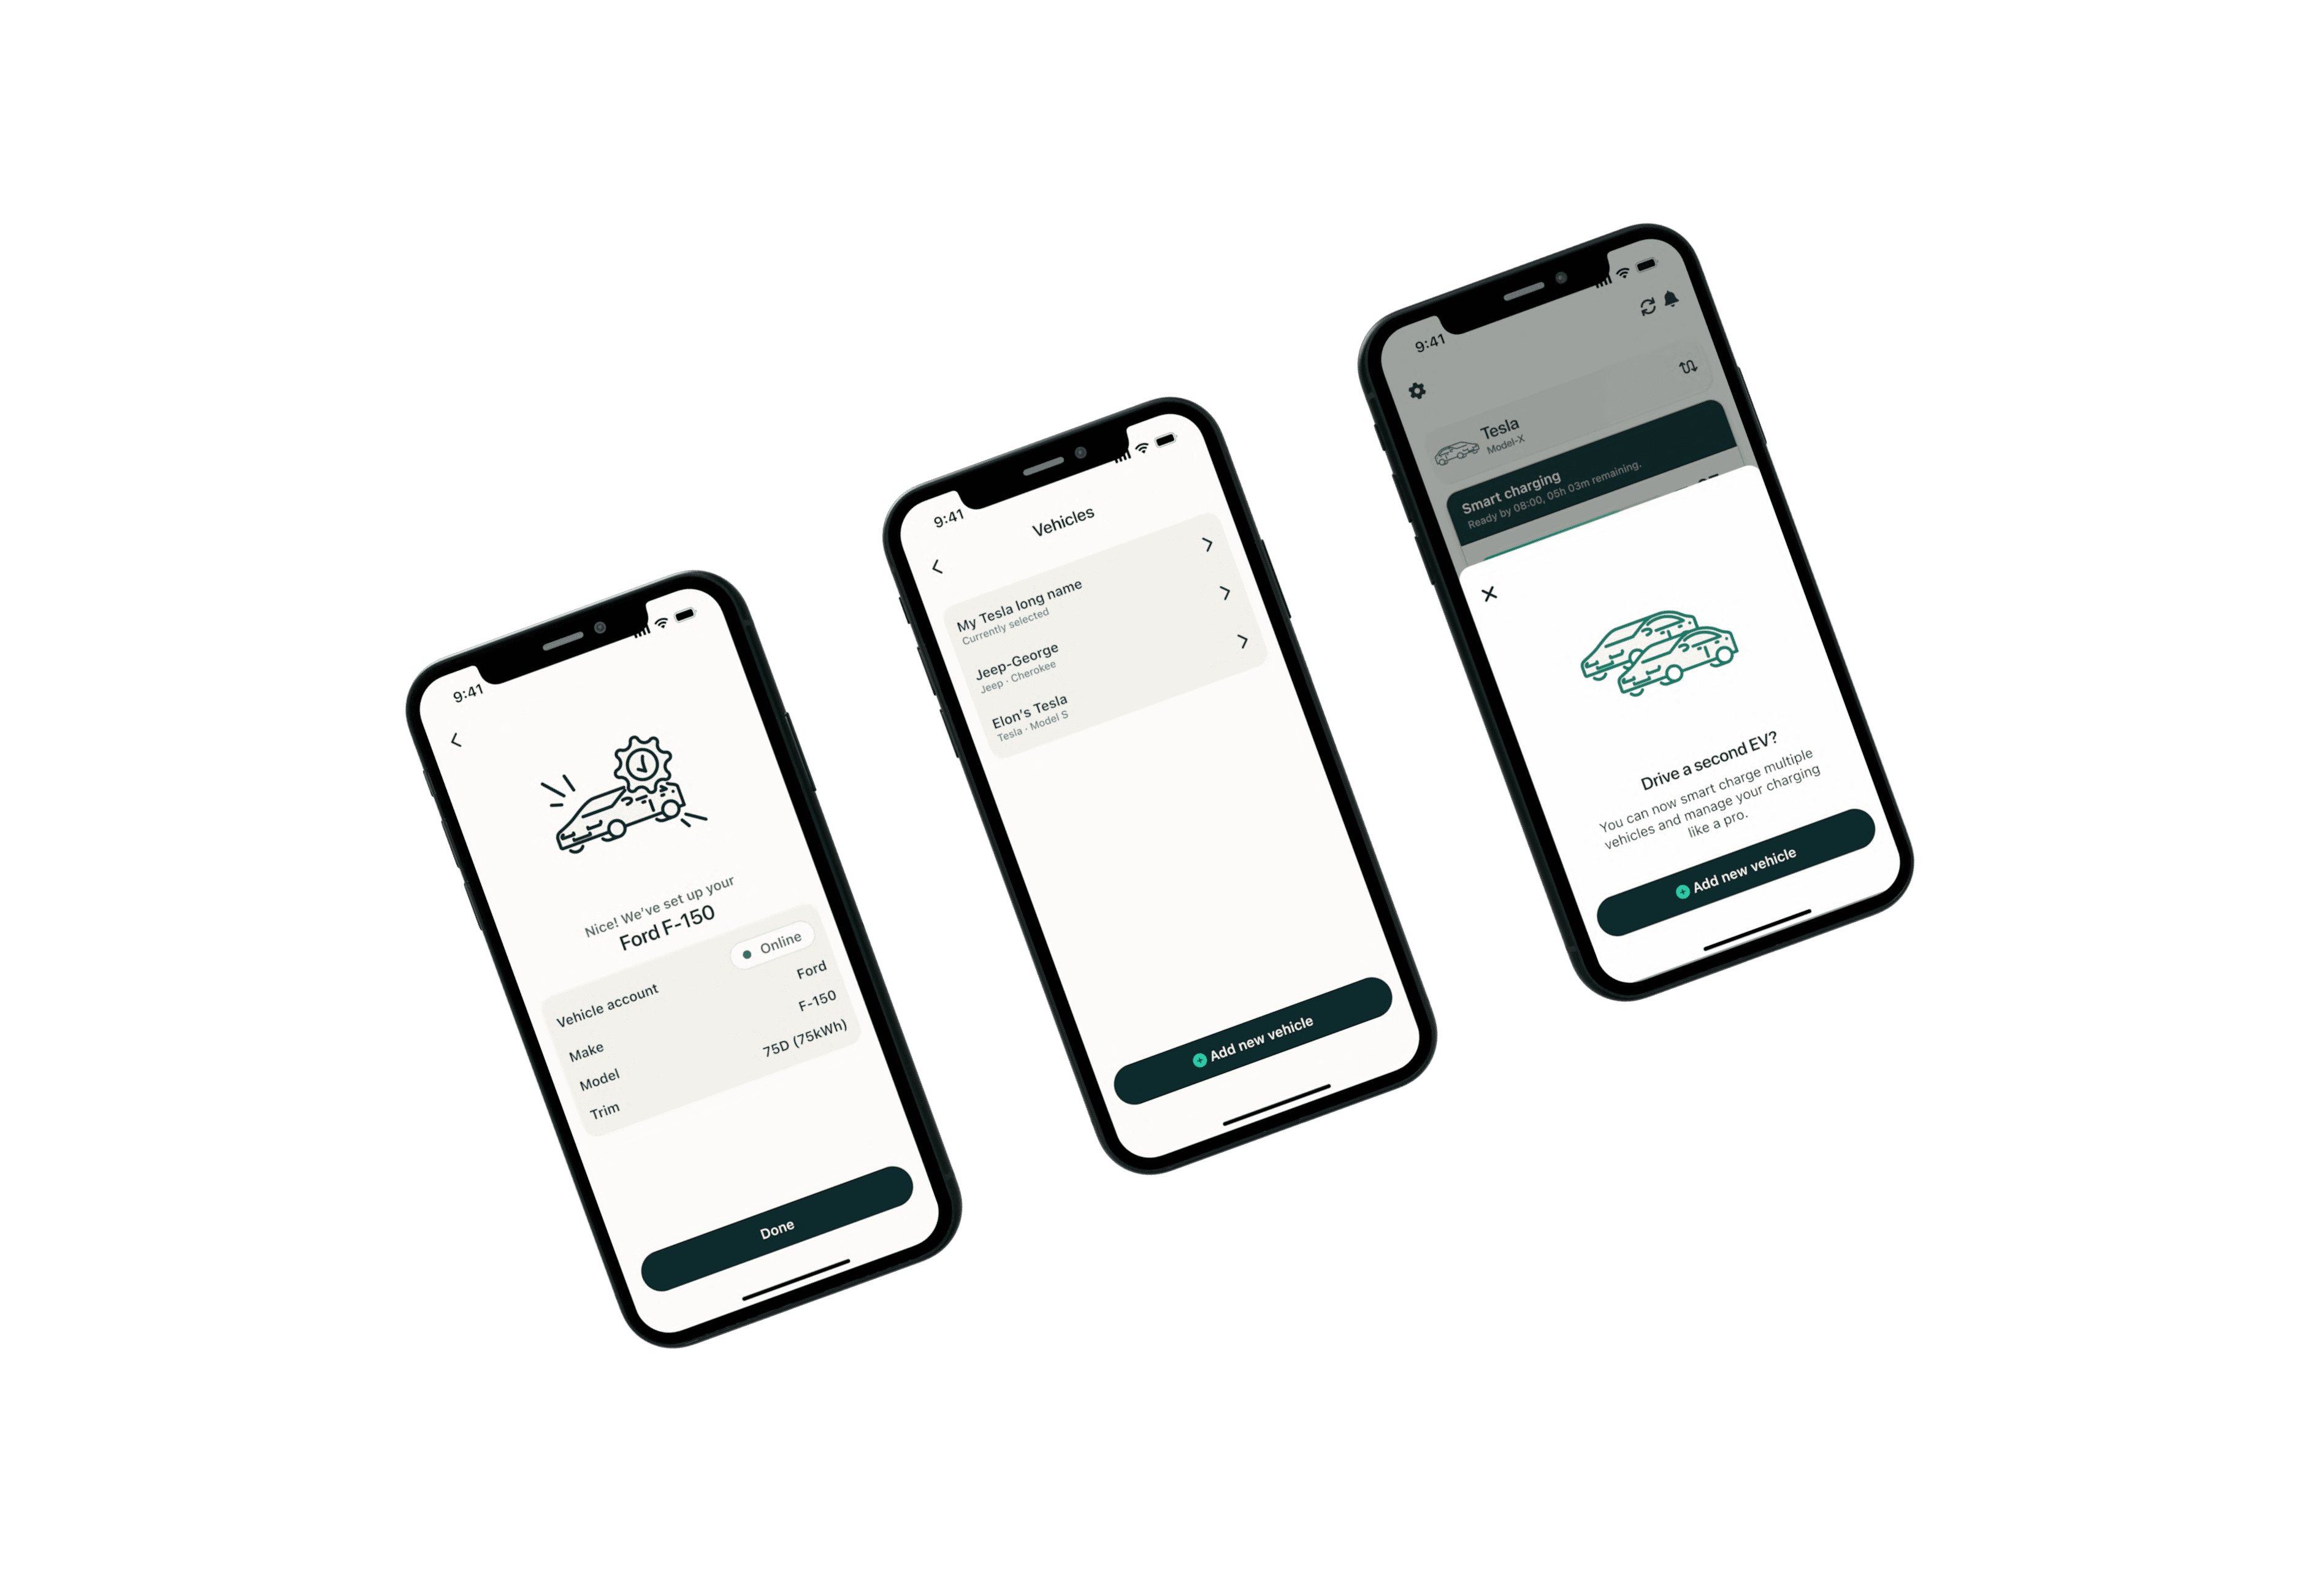
Designed a multi-EV feature that addressed key user needs, boosting adoption by 11% and enabling businesses to better support environmental initiatives through enhanced usability and efficiency.
My role and contribution
Lead designer - Oversaw the project from initial planning and requirements gathering, through strategic alignment, user research, wireframing, to the final visual design stage.
Team
1 x Product designer, 1 x PM, 2 x Engineer, 1 x QA
Timeline
2 weeks

EMPATHISE
2
3
Identifying user and business challenges
User needs
I've identified key user desires, including the ability to add and manage multiple EVs, reduce carbon footprints, and save costs.
Hit on the business
A significant 10% of users encounter difficulties adding an additional EV, leading to a concerning 15% drop in retention rates.
Why to solve these issues
Meeting user needs and enhancing their satisfaction.
Capturing market share and driving revenue growth.
Contributes positively to environmental sustainability.
EMPATHISE
2
3
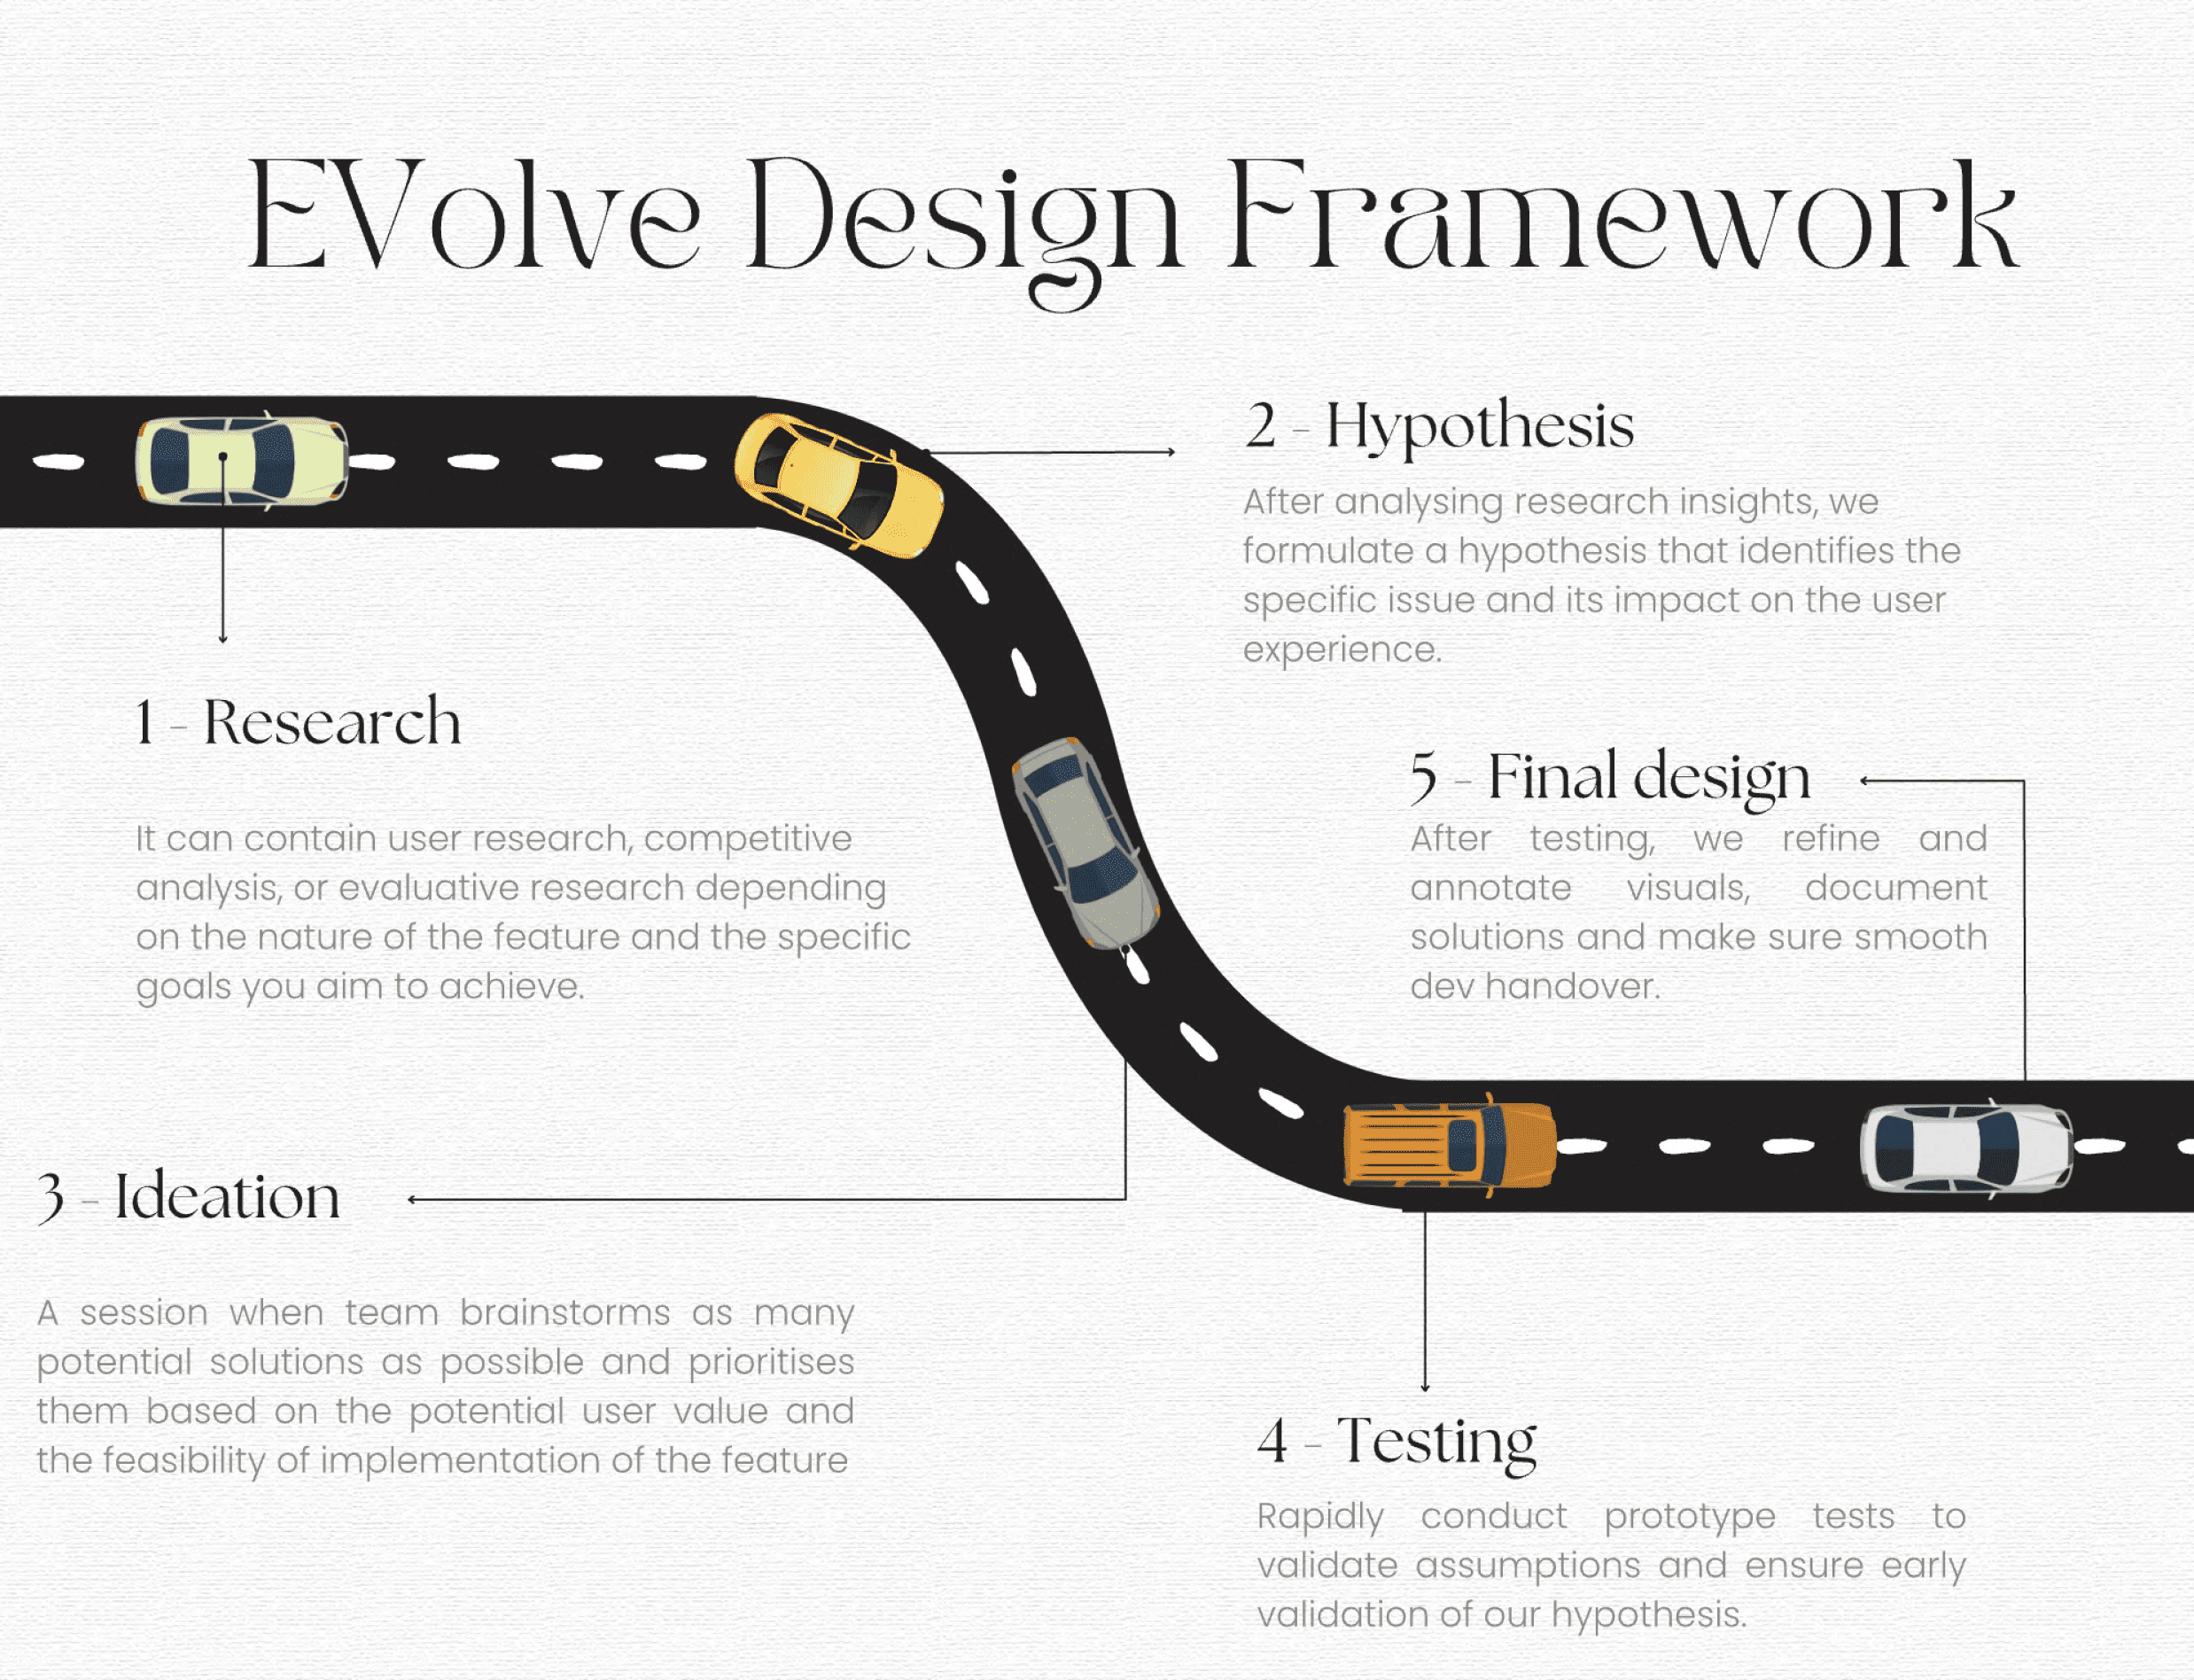
Game-changer tailored framework
We were facing time constraints and also wanted to use a continuous research philosophy while being willing to base our solution on ideation.
As a result
To achieve this, I combined Design Thinking, Lean UX, and Sprint frameworks to create a new methodology called EVolve.
EMPATHISE
2
3
Navigating research terrain
At first, I defined research objectives and questions. Based on the objective to understand the motivations of users adding additional EV, I decided to use qualitative method primarily, complemented by quantitative method, to validate findings and gain a better understanding:
Exploratory User Interviews (Primary): Delved deep into user experiences, serving as the foundation for understanding nuanced perspectives and pain points.
Secondary Data Research (Primary): Used existing data to complement primary research, enriching our understanding of the problem context.
Online Surveys and Questionnaires (Supplementary): Expanded our data pool, capturing diverse user sentiments and behaviours to validate our findings.
1
2. CONCEPTUALISE
3
Key research findings
User behaviour
Most users’ 2nd EV belongs to their family members. They either have 2 chargers, 1 charger or Charger & Solar.
EVs charging preferences
Users with multiple EVs manage charging schedules to avoid simultaneous charging, considering battery range, usage patterns, and charging frequencies
Charging time and grid demand
Varying grid demands make it challenging for users to ensure their EVs are charged when needed, leading to uncertainty about having a fully charged car at a specific time.
Financial considerations
Some users consider financial aspects like tax benefits, leasing options, and overall costs, with price and incentives influencing their decisions
1
2. CONCEPTUALISE
3
Hypothesis
We can simplify vehicle control, switching, and tracking by using a solution that focuses on user needs and supports multiple electric vehicles.
This will improve the user experience and encourage more people to smart charge through our app.
1
2. CONCEPTUALISE
3
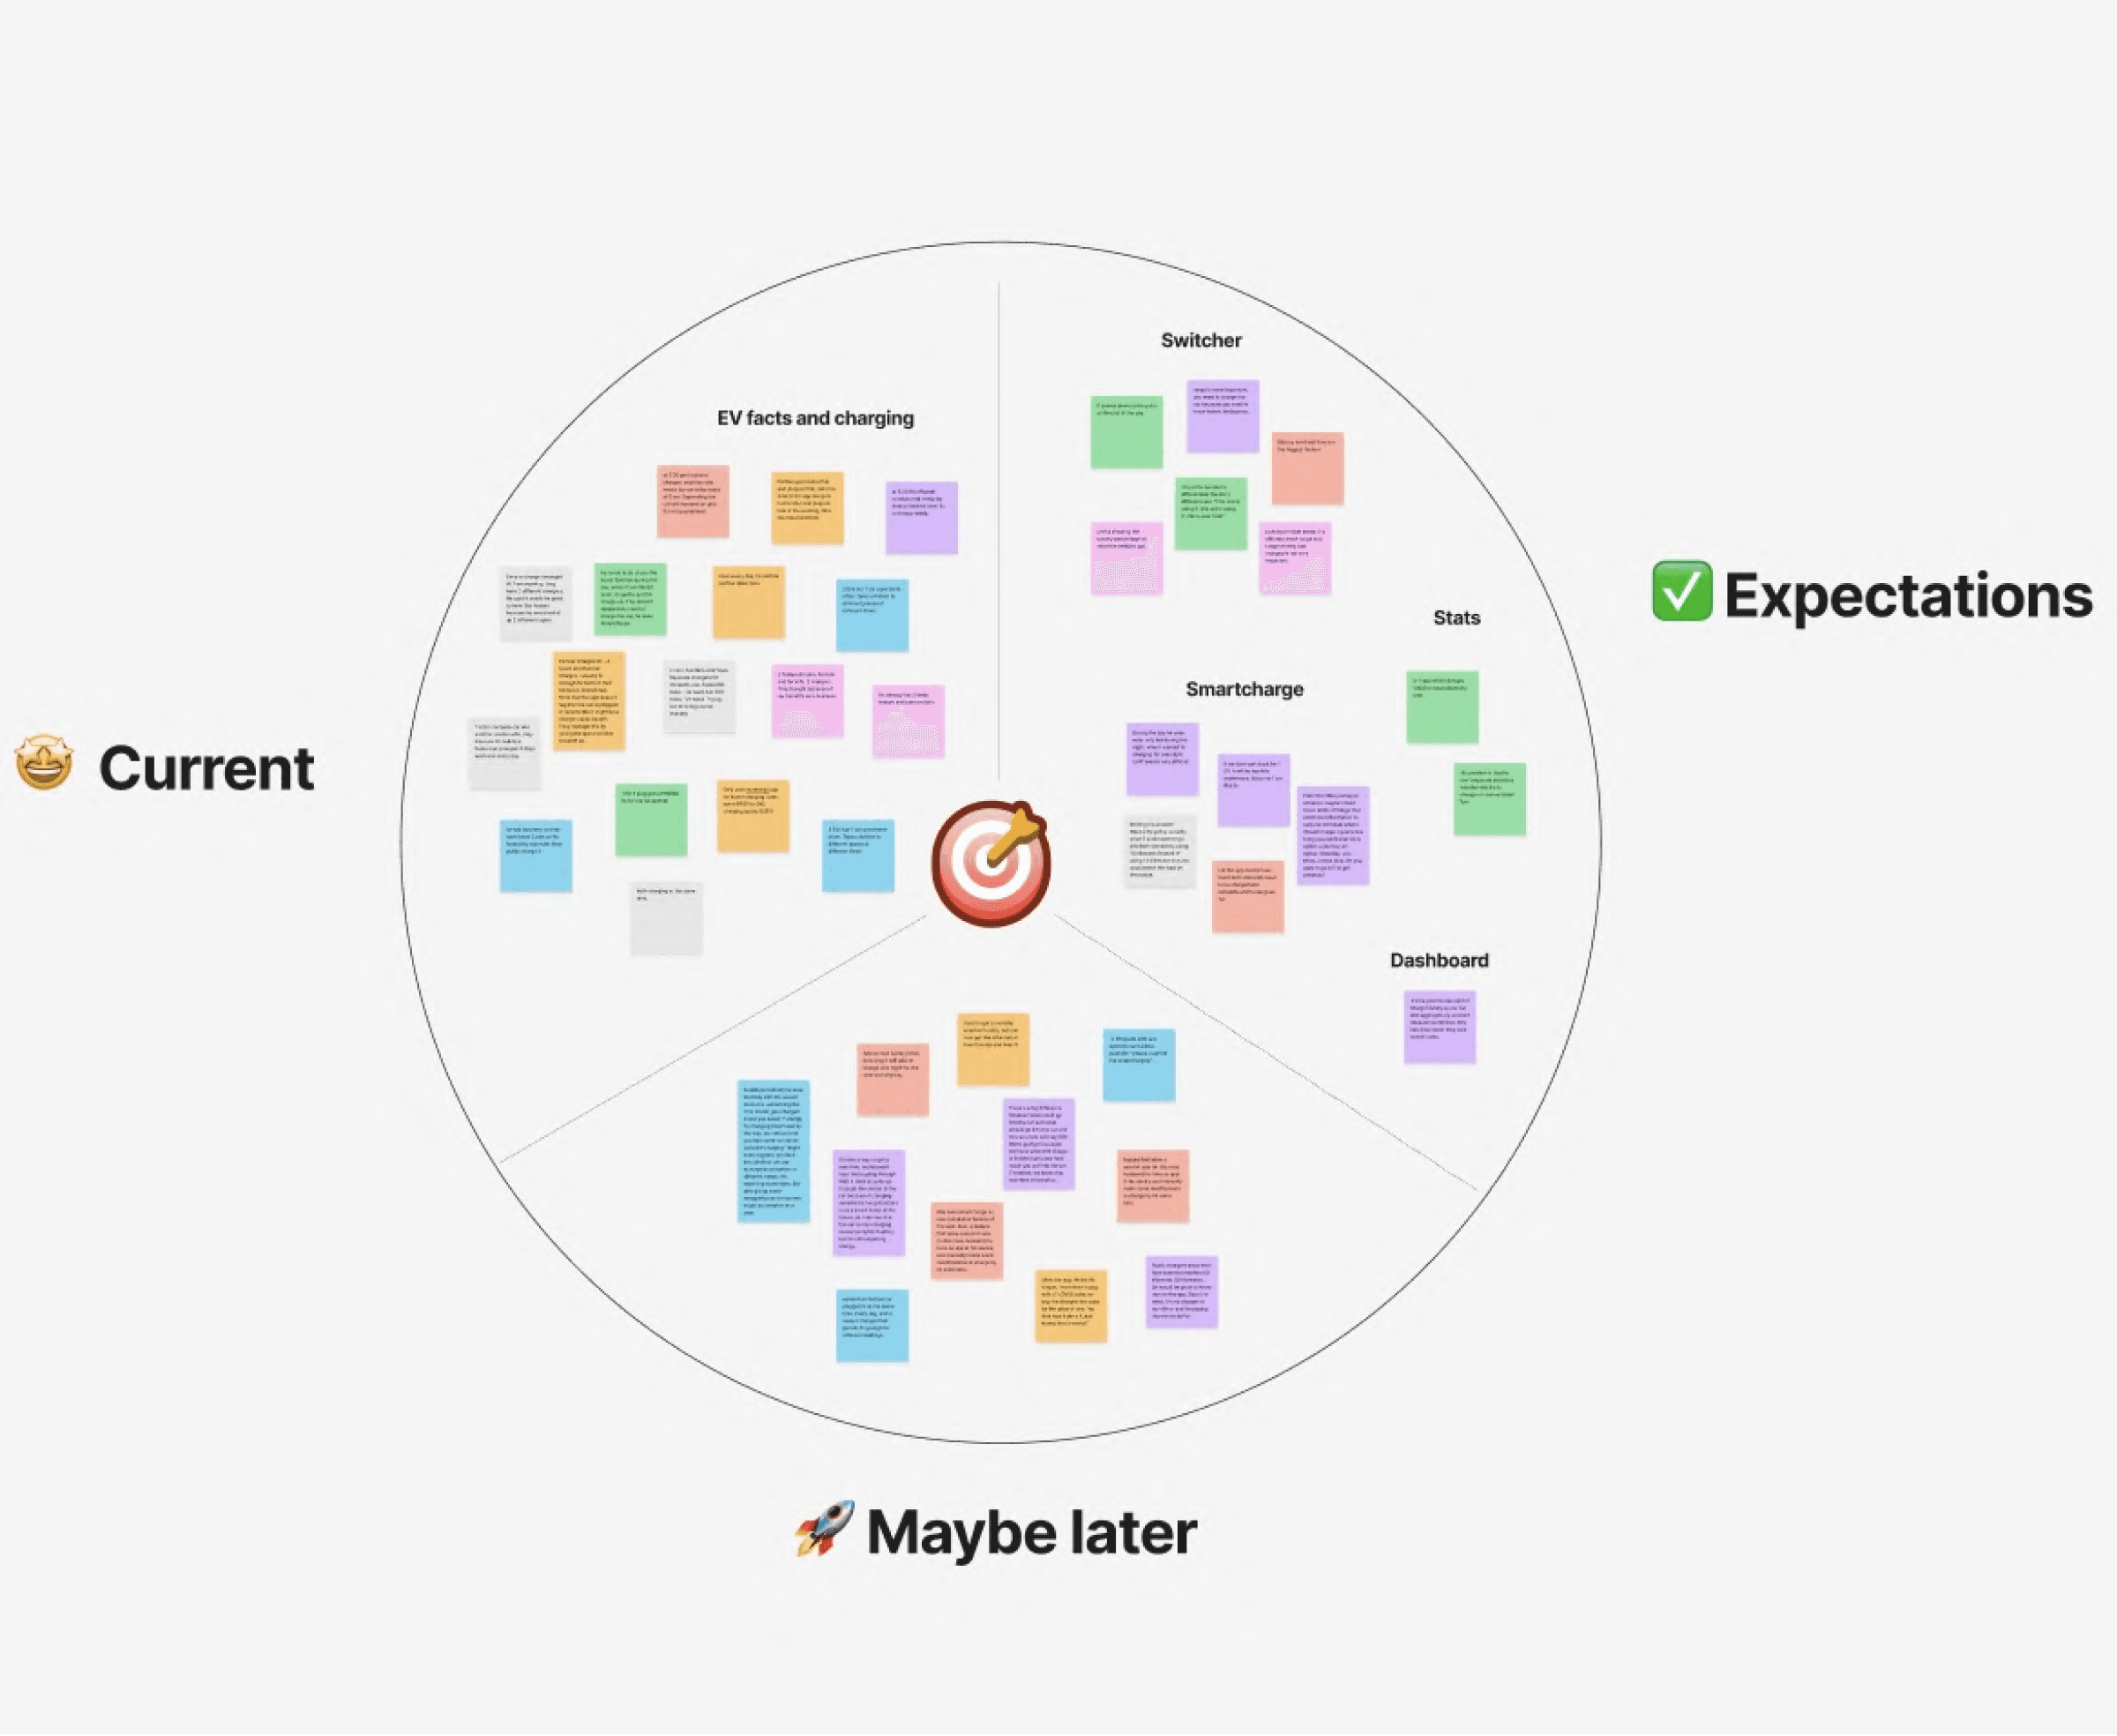
Prioritise for a better value
Competitor research - none of our direct competitors had that feature, creating an opportunity for us. We also explored indirect competitors managing account switches.
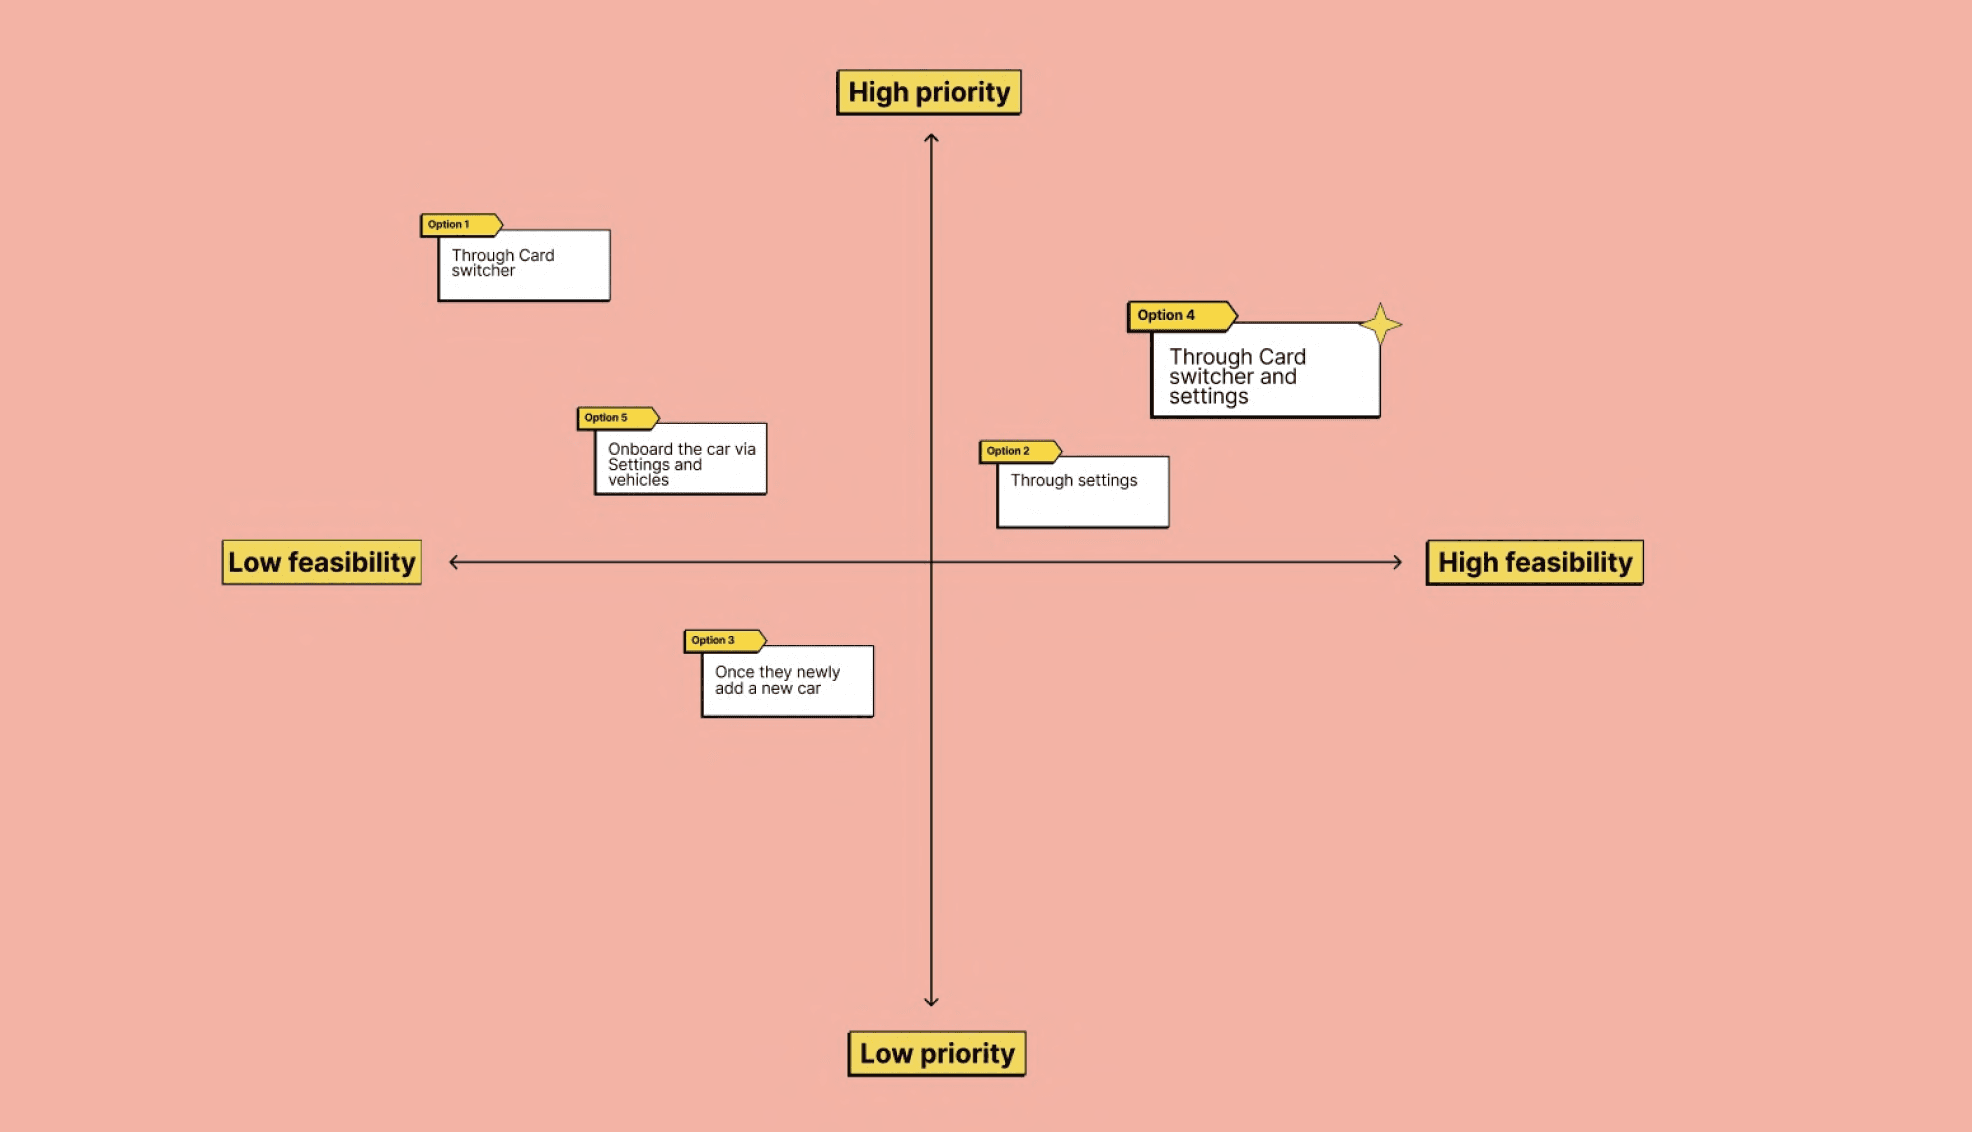
Ideation and prioritisation - After gathering insights and brainstorming potential solutions, I documented the ideas for discussion with the product team.
Together, we used a priority matrix to carefully assess and rank each idea, ensuring focus on the most impactful and feasible solutions.
1
2. CONCEPTUALISE
3
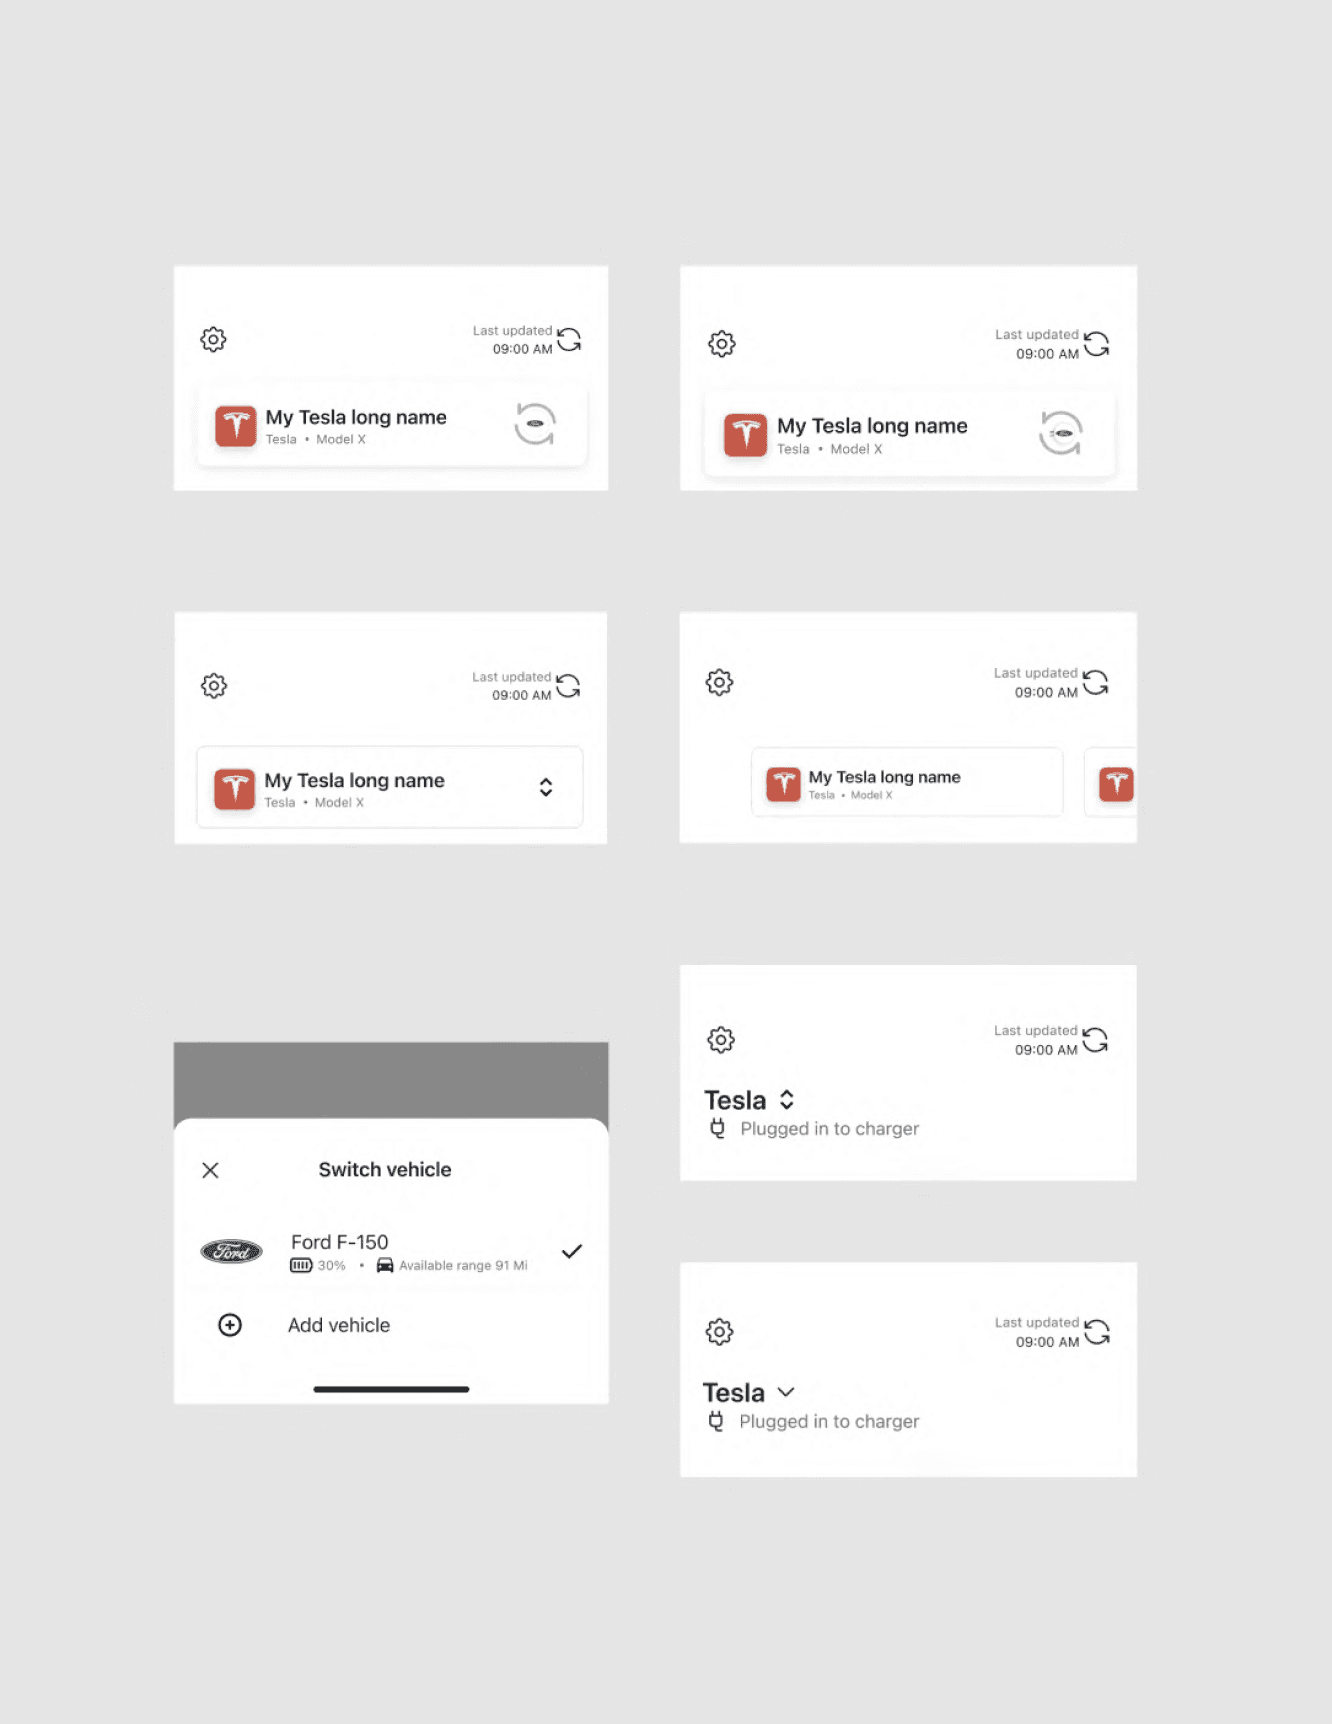
Power of constructive feedback
UI Exploration and feedback - Based on the priority rankings, I explored various options and presented them to the design and product teams for constructive feedback.
This collaborative process ensured that the final design decisions were well-informed and aligned with the project goals and user needs.
1
2
3. DESIGN
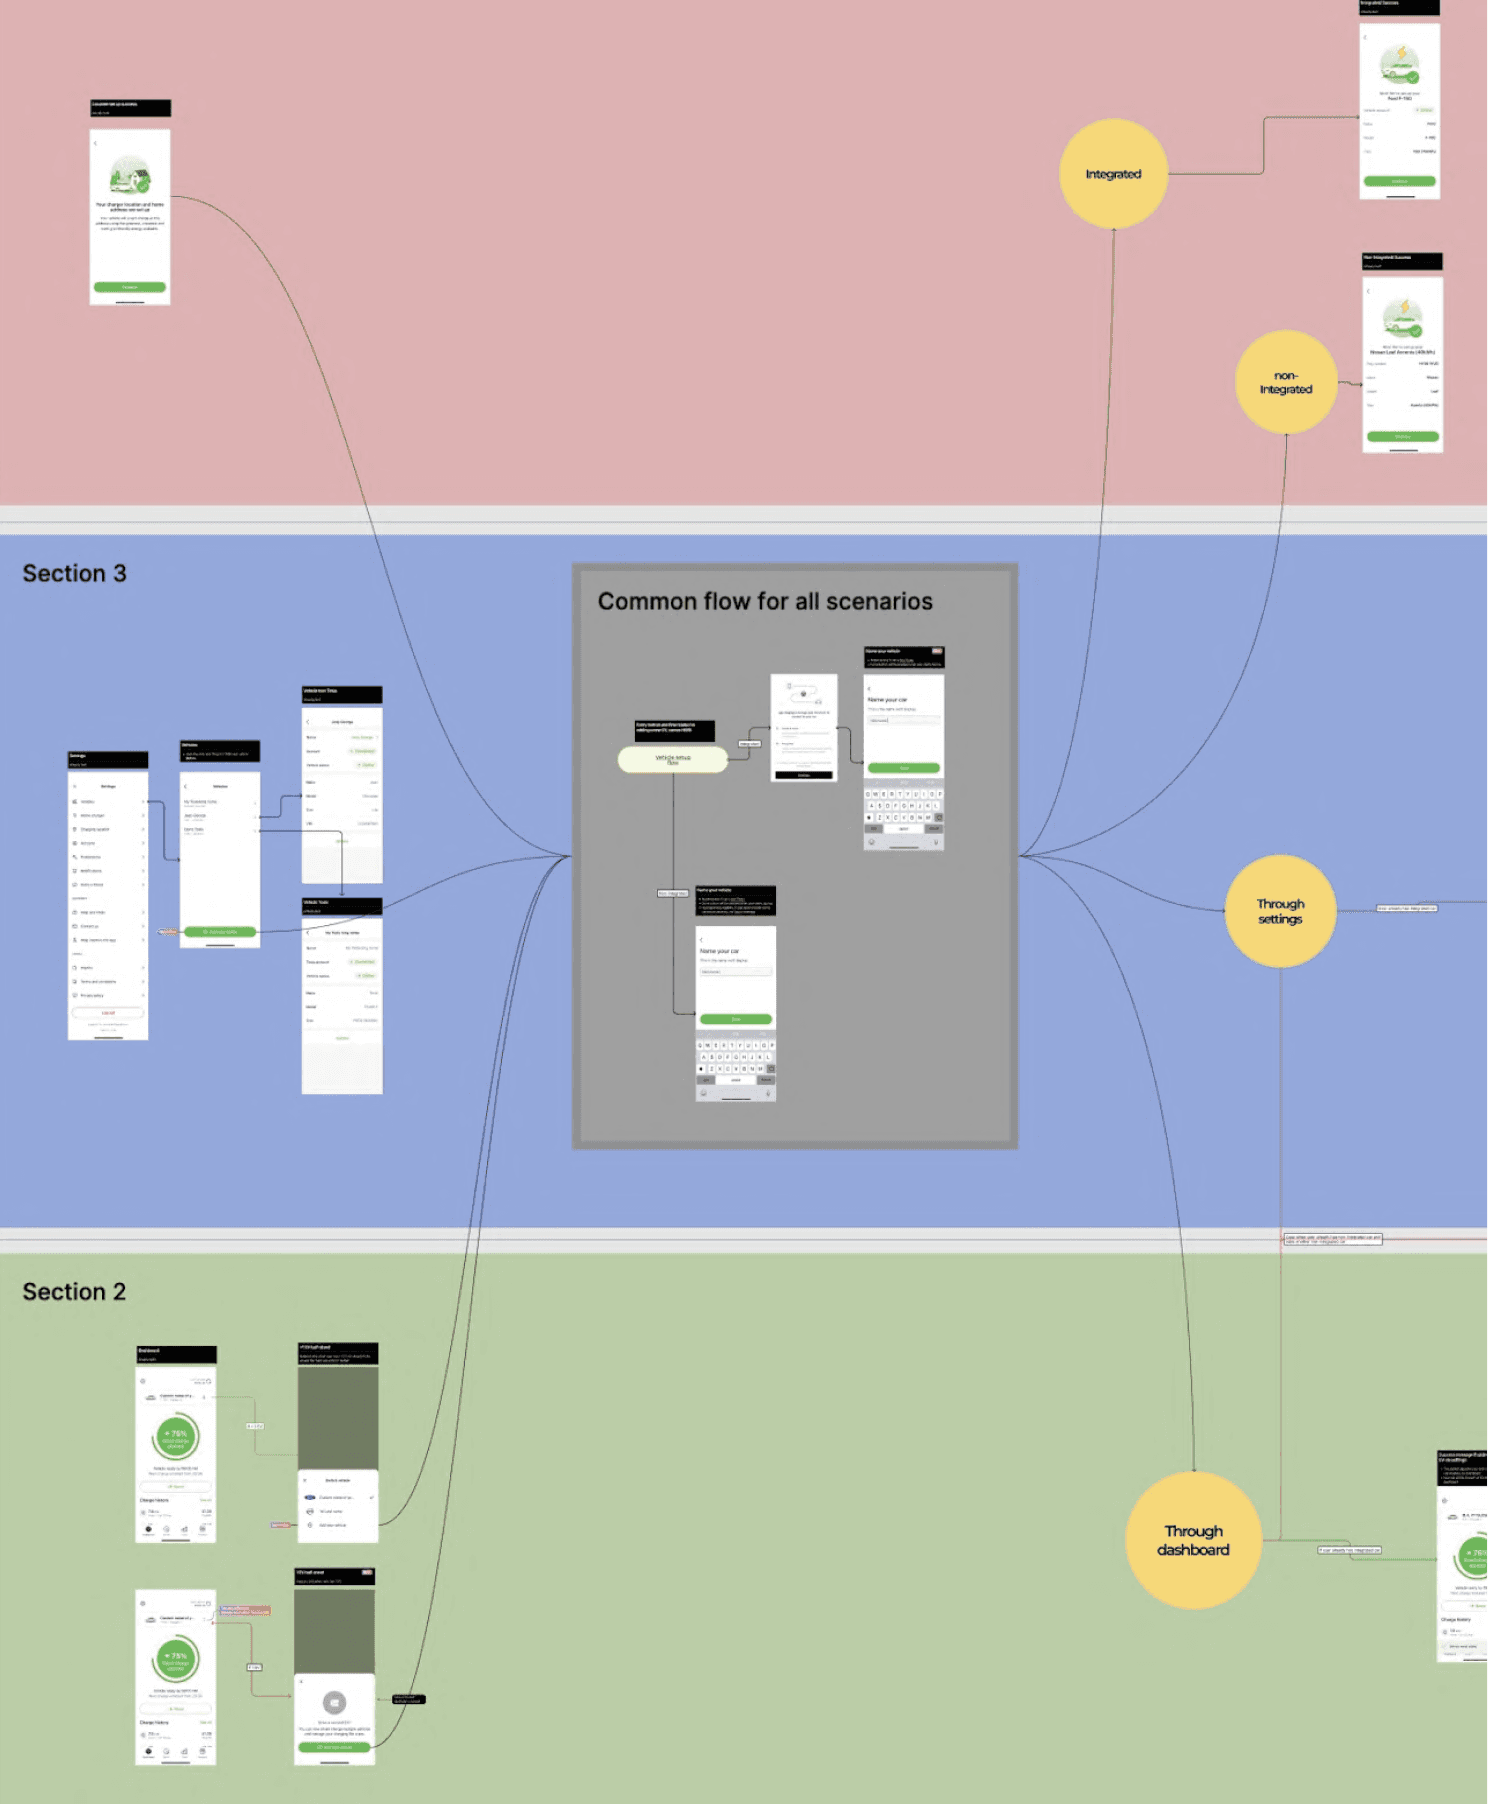
Exploring all the nuances
In this phase, I've mapped out the flow of interactions within the app, considering every conceivable scenario and potential edge case. By visualising the user journey from start to finish, we uncover intricate interdependencies between various features and functionalities of the app.
This process involved a thorough examination of alternative paths, error states, and exceptional circumstances to ensure a seamless user experience under all conditions.
1
2
3. DESIGN
Key learnings and next steps
+11%
Adoption
+7%
kWh delivered
-95%
SC tickets
After launching the feature, I monitored the metrics against the baseline goals using Tableau and our SQL dashboard.
I measured the impact through user adoption rates, task success metrics, and user feedback.
The solution led to an 11% increase in adoption, a 7% improvement in task success, and a 95% improvement in user reviews.

Learnings
Prototyping and Testing
Did not have a chance to test the prototype, but if possible, it's always ideal to find potential issues early on and ensure that the final product meets user needs.Continuous Learning
Emphasise the importance of continuous learning and adaptation. Progression > perfection. Learn from that progress to achieve greater success.
Next steps
Future improvements which were scoped out in that working cycle
Observe users' behaviours and continue validating the insights.
1
2
3. DESIGN
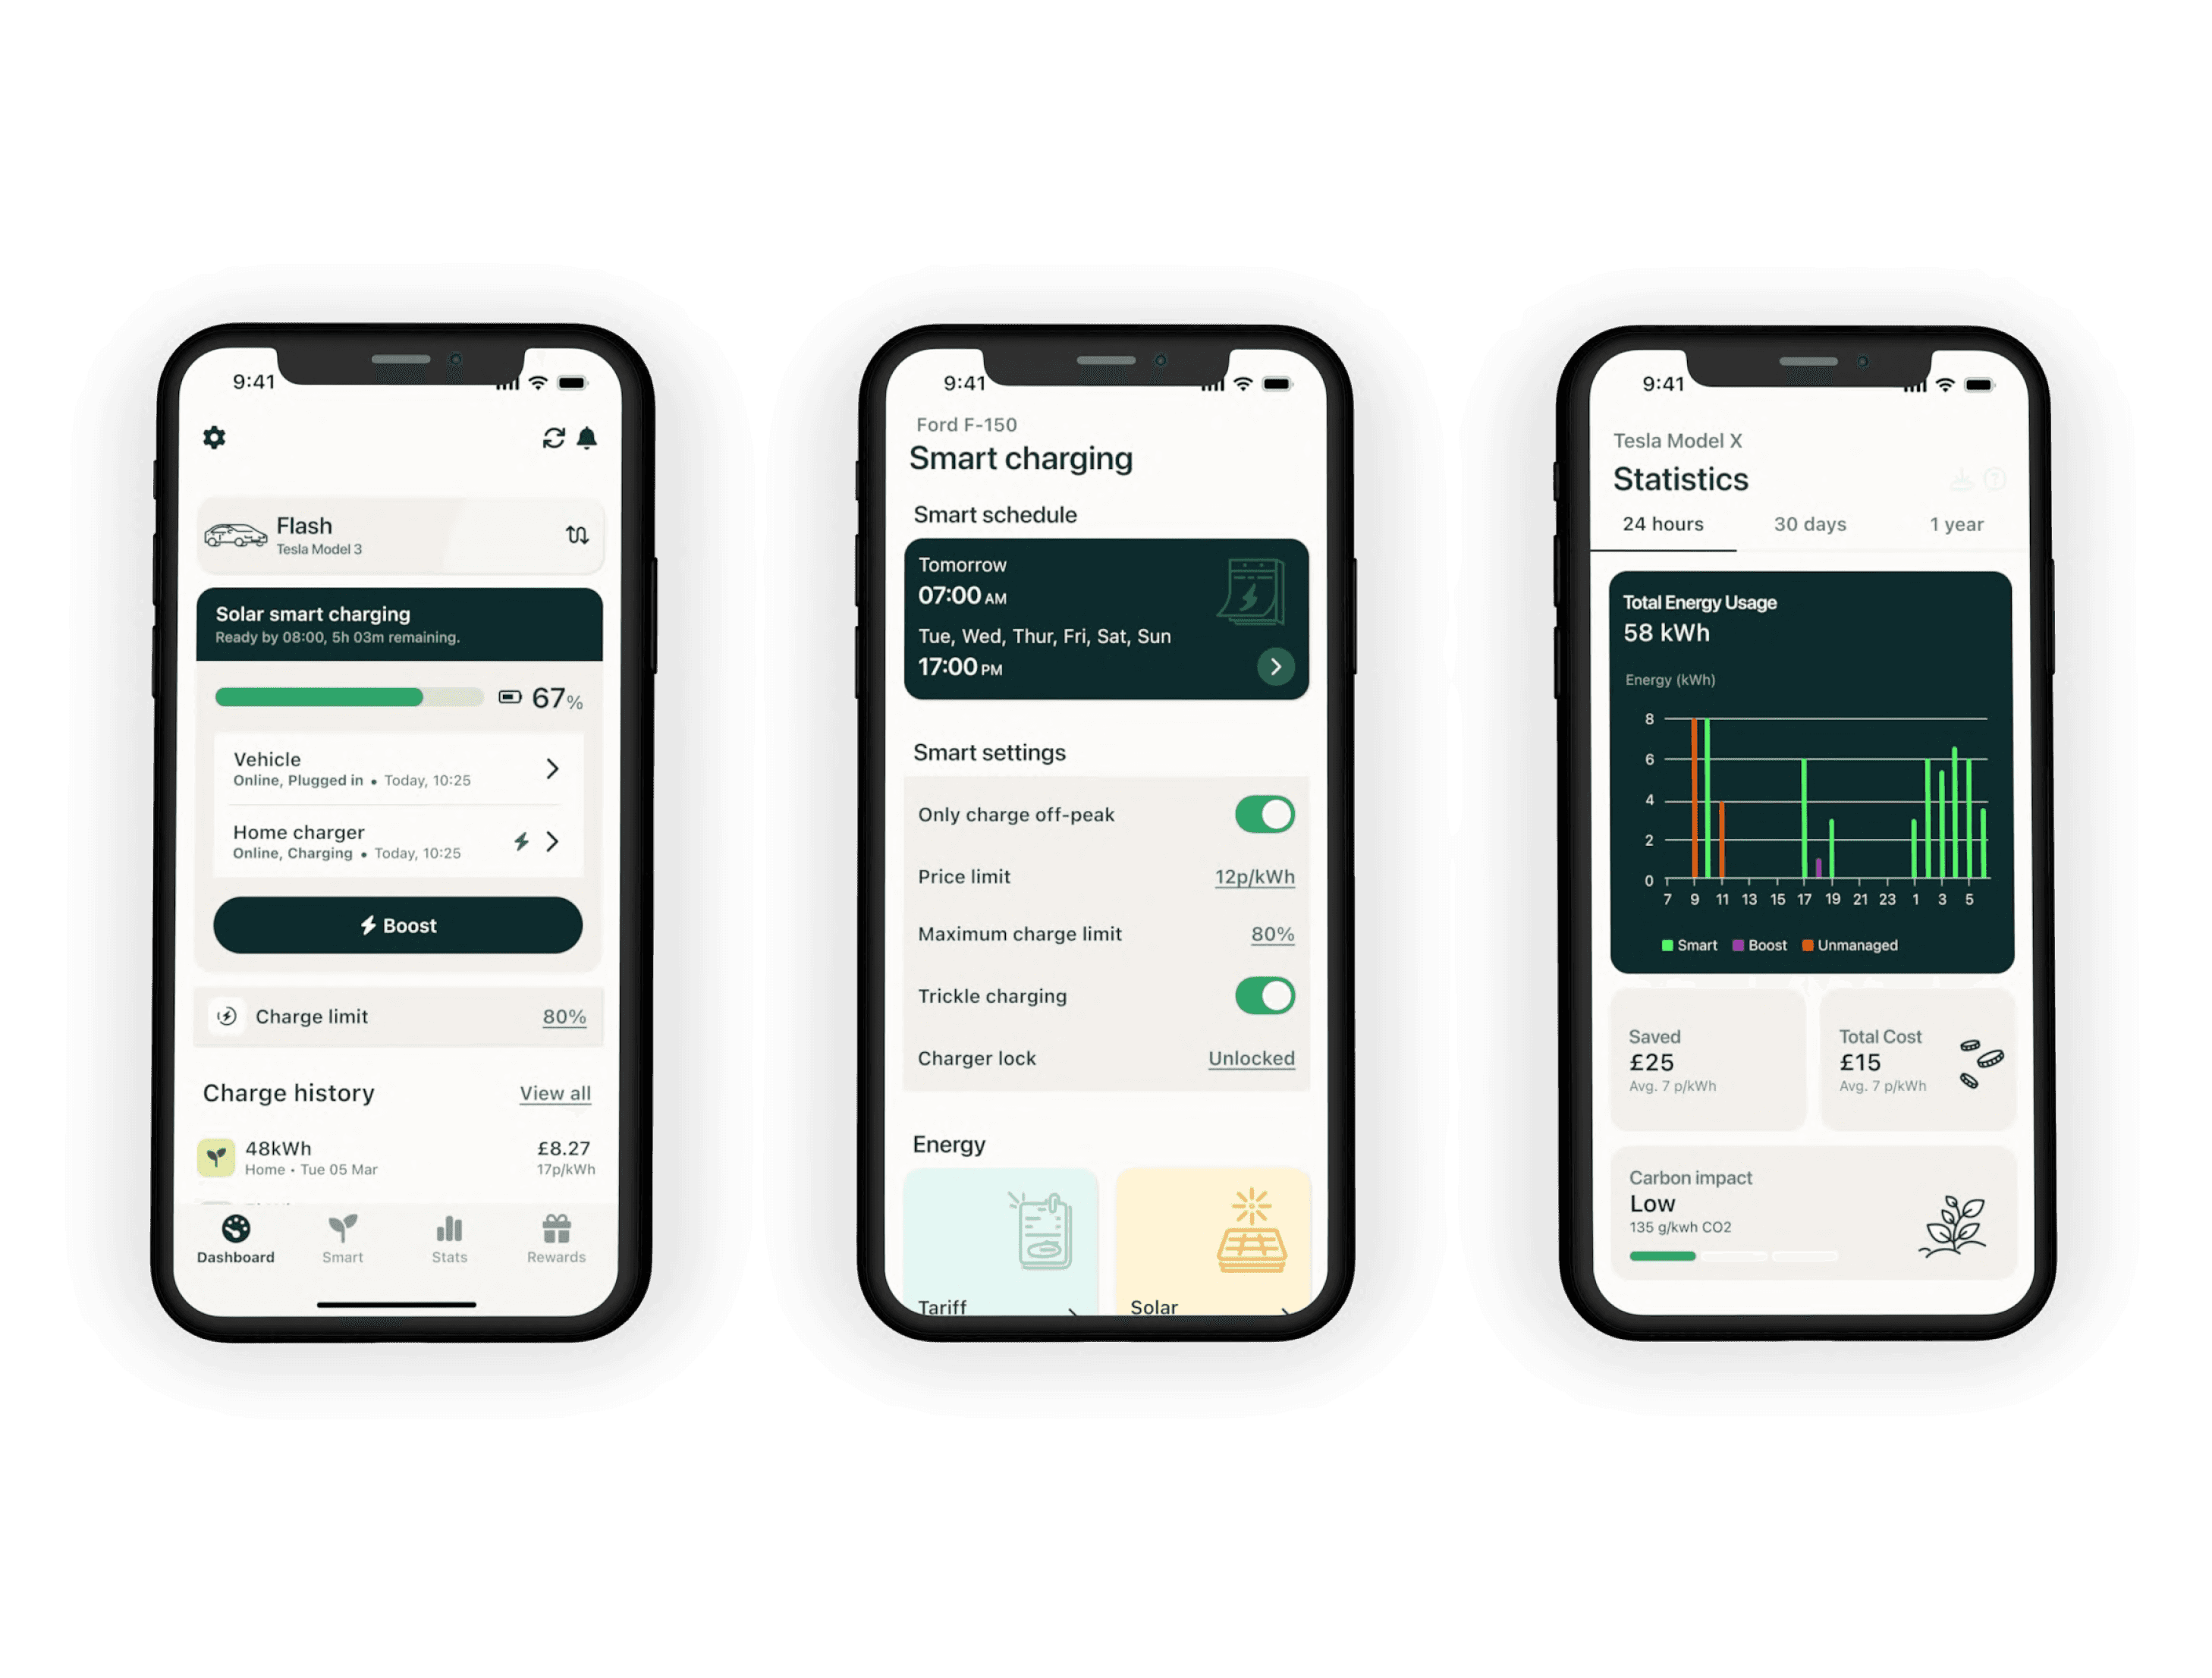
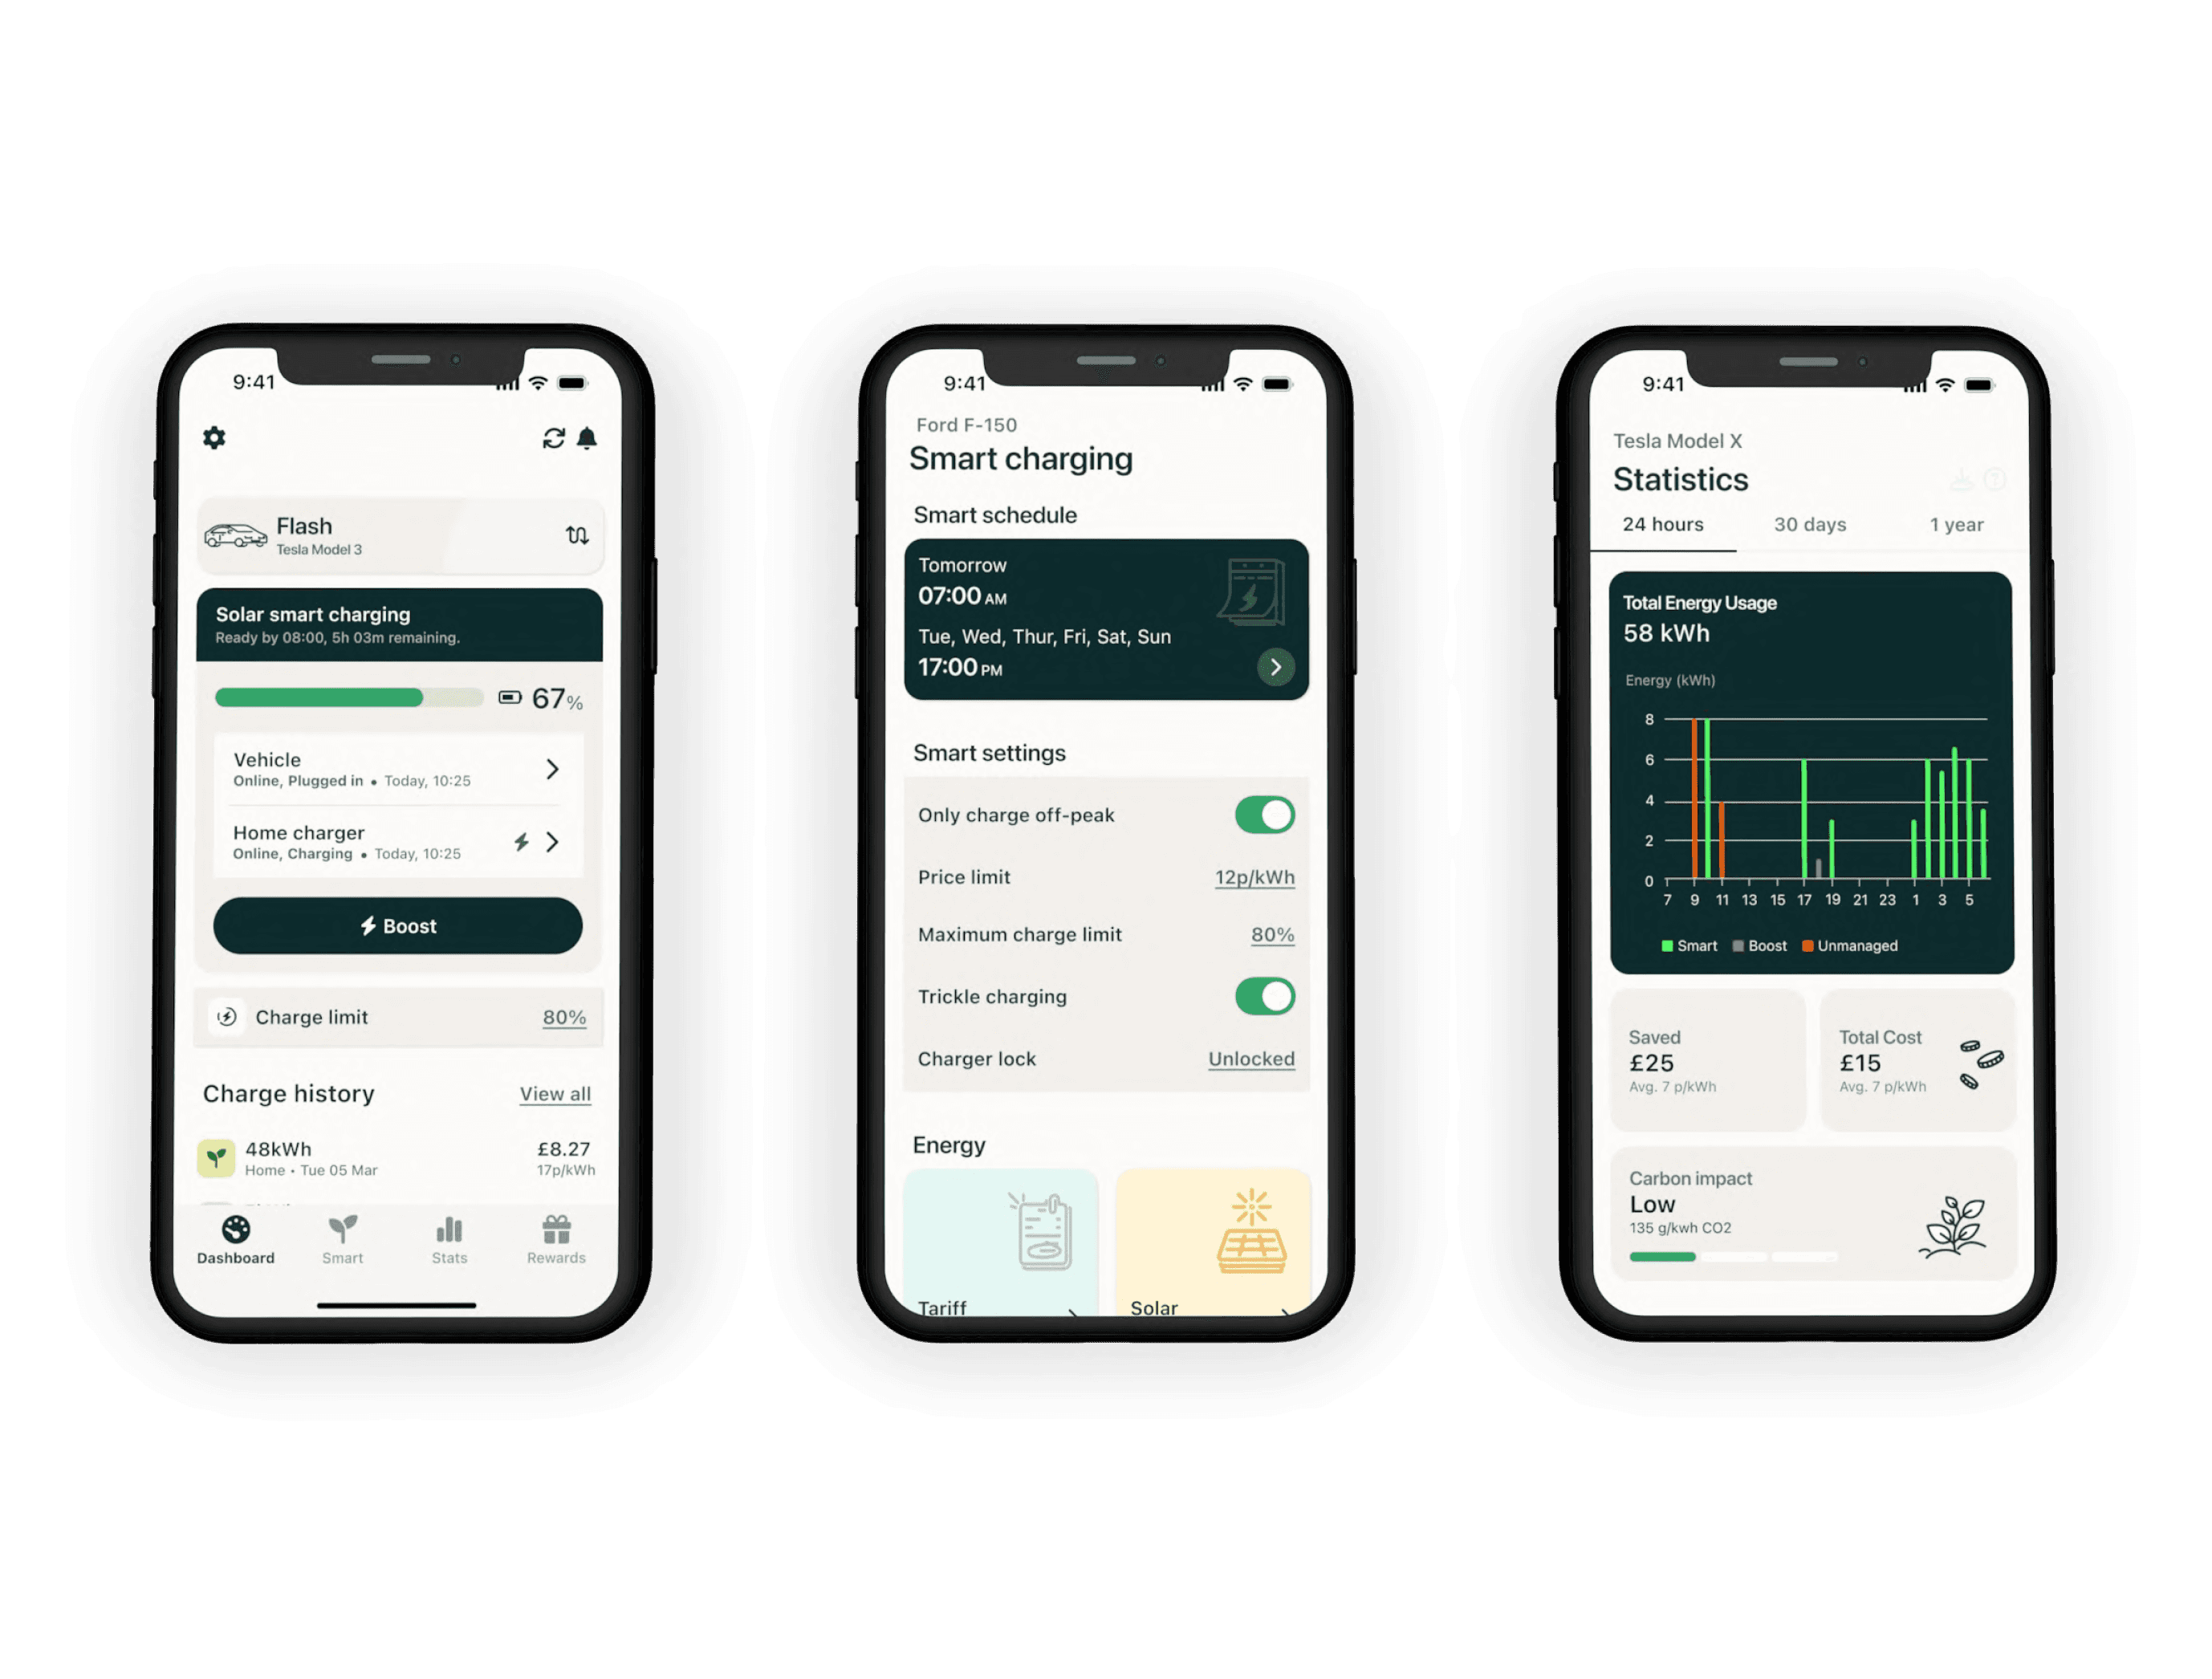
As a result
After mapping out the complete flow,
I used typical hot potato principle to hand the work off to devs, conducted VQA, supported QA to test the feature for beta users at the staging environment and pushed it to the production.
1
2
3. DESIGN
Outcome